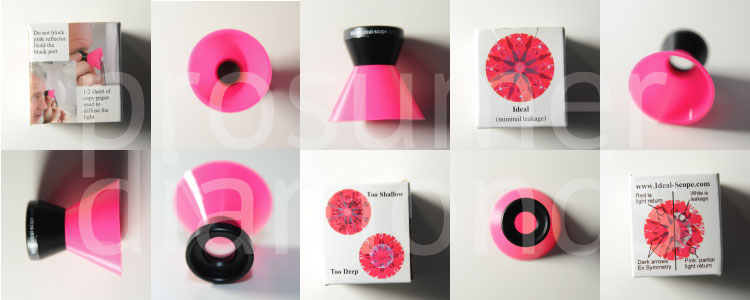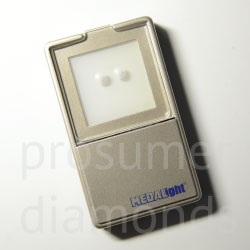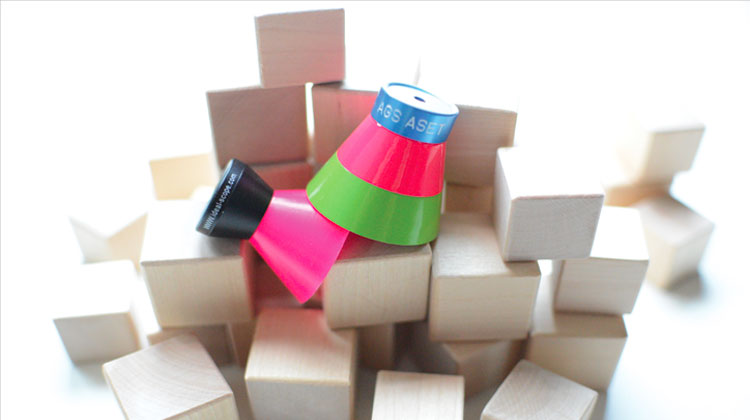
It’s important that you understand that the handheld versions of the idealscope and ASET were designed as rejection tools. However, many online vendors use much larger, professional versions of these tools to produce high-quality images that I am comfortable using to assess a diamond for selection purposes.
The Idealscope
The idealscope is a portable device invented by Gary Holloway that is made up of a 10x magnifying lens and a red reflector. It was originally designed for professionals to quickly reject parcels of diamonds. When used properly, the idealscope allows you to quickly determine whether there is light leakage in a diamond.
The idealscope is a good little investment if you’re planning to buy a diamond from a local store. However, you should be aware that despite being popular among online vendors, the idealscope is not a standard evaluation tool for the trade.
Most local jewelry shops won’t have an idealscope or an ASET, and they probably won’t know how to use it. The reason is pretty simple, the majority of diamonds that are in stores are those that you wouldn’t buy once you’ve assessed it with an idealscope.
How to use an Idealscope
Even though the idealscope is simple to use once you know how, I’ve seen enough beginners use the idealscope for the first time to know that it’s not super intuitive. If you don’t use it right, you’re not going to get the right results.
To use the idealscope properly, the bottom of the idealscope should be aligned with the girdle of the diamond. The diamond is viewed through the lens at the top of the idealscope. It’s best if there is a light source directly behind the diamond.
If you hold the idealscope up to a bright light, the image you see will be blown out so the best way to view an idealscope is under an ideal-light.
The ideal-light was developed specifically for the idealscope. It’s a good thing to have if you ever wanted to take reproducible idealscope images yourself.
If you choose to hold the idealscope instead of using the ideal-light, Gary Holloway recommends holding it up against a desk lamp with a piece of paper in front of it. From my own tests, I have found that sticking a piece of facial tissue in front of a typical fluorescent desk lamp can give good results.
Assessing Idealscope Images
What you’re looking for in a well-cut diamond are dark arrows with the rest of the diamond being bright red or pink. The objective of using the idealscope is to compare the shades of red throughout a diamond. The actual shade of red is not as important as the relative saturation between the shades of red that can be seen in any given idealscope image. Don’t expect the same shade of red throughout the diamond, a diamond is designed to have varying intensity of light return to create a structured contrast in the diamond.
There are 3 things you can tell immediately from an idealscope image.
• Saturated red areas representing excellent light return
• Black areas representing head and body obstruction
• White areas where light is leaking
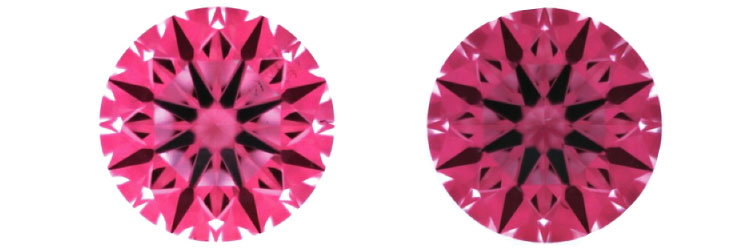
Here’s a comparison of two idealscope images.
(The images above are courtesy of James Allen, used with their permission.)
The image on the left has some light leakage around the edges of the diamond where the upper girdles are. This is what is expected in a classic ideal-cut diamond.
A cutting techniques known as ‘crown-only painting’ can improve the light return in these areas. The image on the right is an example of a diamond that has slight painting. More importantly, the idealscope image on the left indicates that this diamond has some light leakage under the table facet so we can quickly reject it.
In the slightly painted diamond, you can see areas of light reds and darker reds. Lighter reds indicate areas where there is weaker light return and darker reds indicate areas where there is more intense light return.
Notice that the two idealscope images have different brightness. This is more to do with inconsistent photography than the diamonds themselves and is why you should only compare the relative reds that you see in each individual idealscope image.
Ideally, you want to see black arrows and triangles as these create the contrast pattern in the diamond. These areas are called ‘hotspots’ and can also appear near the base of the arrow shafts in diamonds with longer star and lower girdle facets. They’re called hotspots because these are the spots that return the largest flashes when you see fire. I need to clarify that darker arrows does not necessarily mean that the diamond is better, and it can also indicate problems with light obstruction.
When you look at a diamond face up, hotspots reflect the area around your head and body which obstructs the light falling onto the diamond. So when you look at a diamond and see the color of your shirt, or if you have dark hair and the arrows seem to look dark, this is because of the reflections from the hotspots.
A poorly cut diamond with light obstruction problems will have too much darkness visible in the diamond at normal viewing distances. This is something that is difficult to tell in an image unless you have a lot of experience evaluating images taken from a consistent photography setup as well as a deep understanding of diamond optics.
The Angular Spectrum Evaluation Tool (ASET)
The ASET, a tool developed by the AGS, is a piece of reflector technology that works very much like the idealscope. Unlike the idealscope, an ASET image is designed to reveal the direction that a diamond is picking up light from and not to compare light intensities. If you look at a handheld ASET scope, you will see that its reflector has a three tier design.
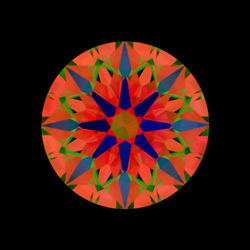
• Blue represents head and body obstruction (between 75 – 90 degrees; 90 being vertical)
• Red represents light returned from sources that are behind you (between 45 – 75 degrees)
• Green represents light returned from the periphery (between 0 and 45 degrees; 0 being horizontal)
The handheld ASET is an ASET 30, which means that it simulates 30 degrees of light obstruction. You may notice that sometimes two ASET images of the same diamond can look completely different. One reason is that vendors usually have access to the desktop version of the ASET that can be used to produce more consistent imagery and these images will look different to images taken through a handheld ASET. Another reason for discrepancies is that it is possible that the other image was taken using an ASET 40, which simulates an observer that is much closer to the diamond.
Also, if you’re comparing a photograph against a computer simulated image, like the one on the AGS Platinum Light Report. The difference is sometimes caused by scanning errors, although in general the representations are quite accurate. Please note that AGS cut grading is not solely based on a single ASET image. In fact, AGS evaluates the light performance of the diamond from many tilt angles in forming their cut grade.
The ASET should be used the same way as the idealscope, although the ASET seems to tolerate a stronger backlight better. What this tells us is that the ASET is not meant to evaluate light leakage. If you’re trying to take an ASET image, you should remember that the idealscope has a magnified lens where the ASET doesn’t. You can read my tutorial on how to take idealscope and ASET images if you’re interested in taking them yourself.
Assessing ASET Images
Here’s the ASET image of a super-ideal diamond from Whiteflash. You can see that there is minimal green that is confined to the upper girdles of the diamond and in the reflection of the table. The green in the upper girdles indicates slight painting. We saw how slight painting affected the idealscope image, so the ASET image is basically telling the same story in a different way.
One frequently asked question is why the center of a diamond is sometimes red and sometimes green in an ASET and whether a red center is preferable to a green center.
The center of the diamond is called a table reflection, because it is the reflection of the table facet. For any given diamond, depending on the pavilion angle, the table reflection can be red, green, or a mix of red and green on an ASET. For a 57% table, the table reflection turns green precisely when the pavilion angle is 40.768 degrees. Whether this matters or not depends on who you ask. Personally, I think that it’s not a big deal if a table reflection is green and AGS seems to agree because two-thirds of the diamonds in the AGS0 range are predicted to have a green table reflection face up.
Conclusion
Two diamonds that have great light performance and optical symmetry can look completely different because there are many different flavors of diamonds. So before you rush to buy a diamond with your new found knowledge, you need to find out what your preferences are on the different characteristics diamonds can have. If you’re having trouble evaluating light performance images, please get in touch and I will be happy to take a look for you.
