For example, idealscope and ASET images only show you a diamond in a single viewing environment where in reality you will be looking at your diamond from many different angles under many different viewing conditions. The Holloway Cut Advisor (HCA), which is probably the most misused tool out there suffers from being two-dimensional and does not take into account of three-dimensional cut precision.
So wouldn’t it be great if there was a single tool that could help us evaluate a diamond under multiple lighting conditions and in three dimensions? Well there is.
Forward Ray-Tracing
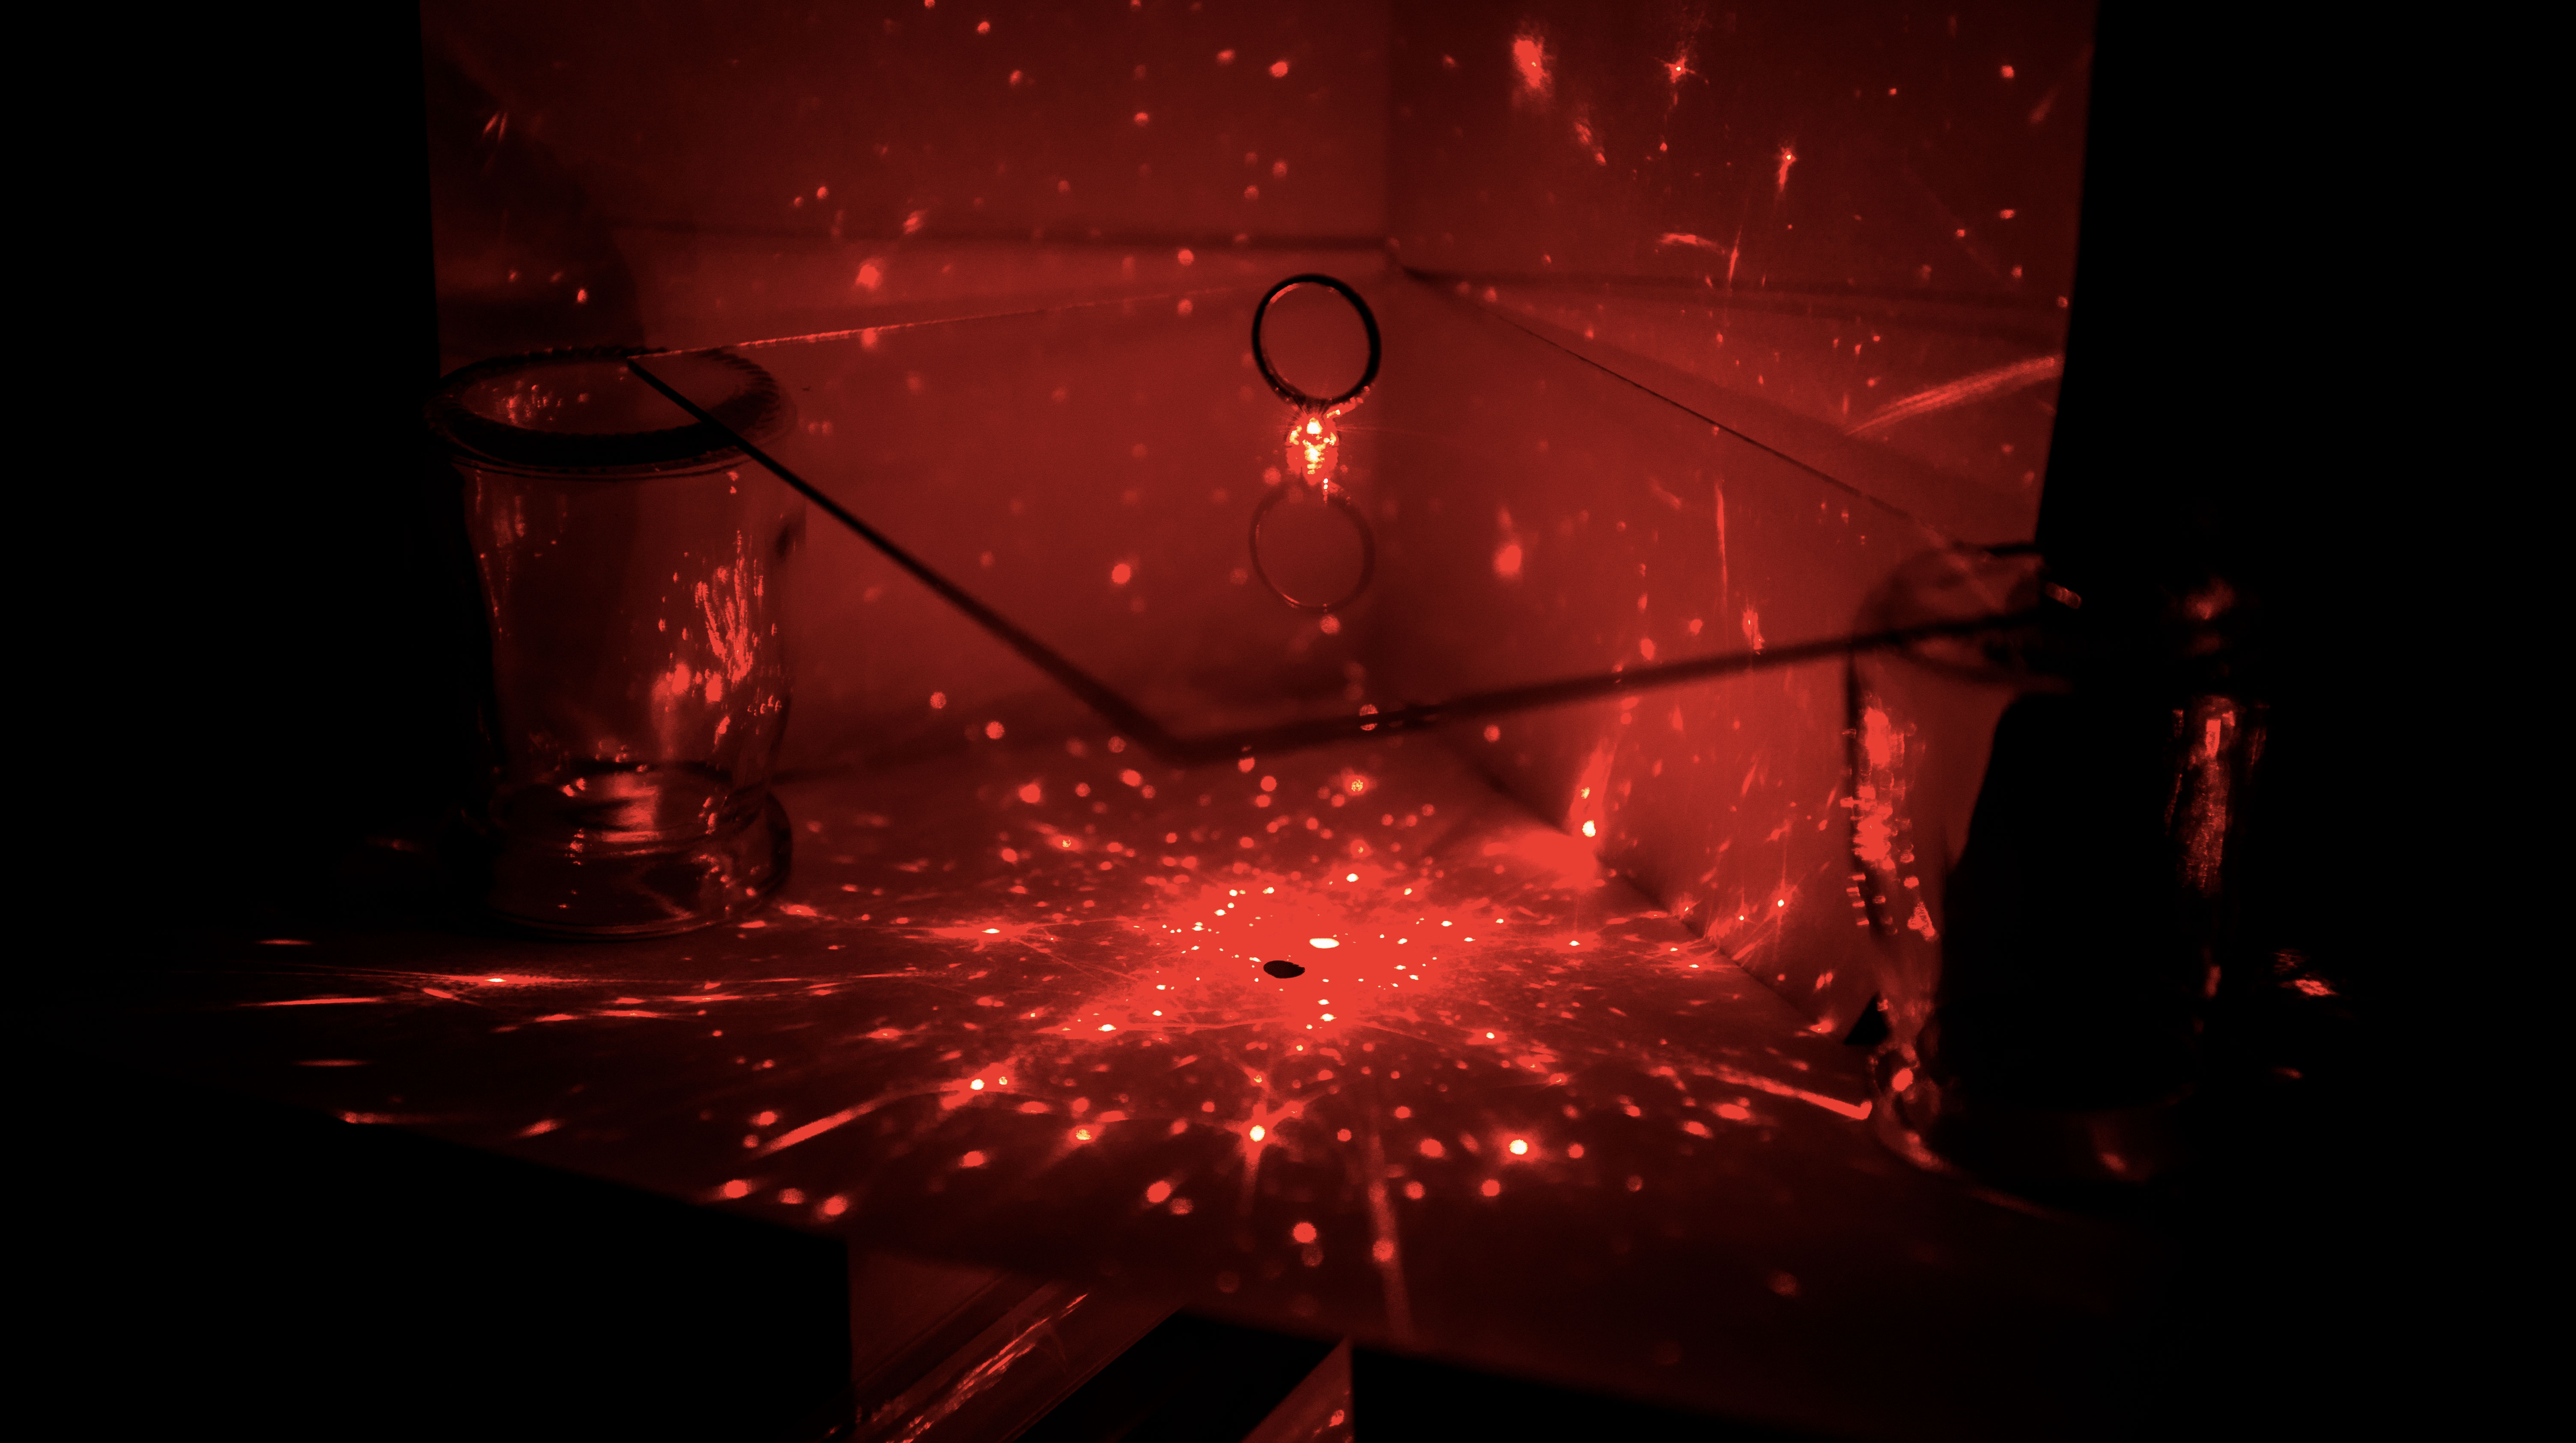
Ray-tracing is one of the techniques that experts use to generate maps that can be used to evaluate a diamond in three dimensions. Ray-tracing involves directing a laser at a diamond, and following the beam of light as it travels through the diamond.

Forward ray-tracing is defined as being from the light source, through the diamond, and to the observer and it is important to distinguish forward ray-tracing from ‘reverse’ ray-tracing, which I will discuss later. Forward ray-tracing allows us to evaluate dispersion (fire) visually. If you have a laser pointer, you can actually try forward ray-tracing at home to generate a dispersion pattern pointing a laser at your diamond. Just be very careful where you aim so you don’t shine the laser into someone’s eye.

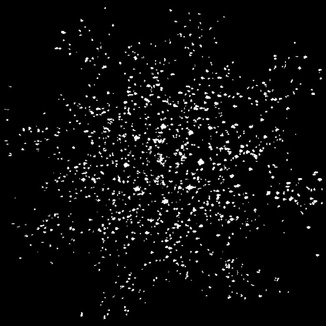
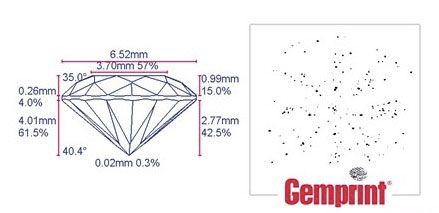
A dispersion pattern has practical applications beyond evaluating its light performance because at sufficiently high resolution, a dispersion pattern can be used for identification purposes and is the concept behind Gemprint. Having a diamond that has been Gemprinted will help lower your costs of insuring that diamond and most of the reputable jewellery insurers will offer a 10% discount if your diamond is registered with Gemprint.
This is one of the advantages of buying a Blue Nile Signature Ideal diamond because they all come with GCAL certification and have been Gemprinted. It is important to know that Gemprint charges you a $50 registration fee in order to get the insurance discount.
Gemprint works by stitching together 9 actual images of the dispersion pattern generated when shining a laser beam directly into the center of a diamond. One image is with the diamond perpendicular to the laser, and then 8 images are cpatured at 12-14 degrees titled from perpendicular as seen below. This produces a dispersion pattern fingerprint of the diamond with a 99% accuracy.

Reverse Ray-Tracing
Reverse ray-tracing allow you to identify where the light sources are that generate flashes of light in a diamond and is best explained with a simple example. If you see a light in a mirror and you aim a laser at the light in the mirror from where you’re standing, the laser will trace a line from you (the observer) to the light source. What you would be doing is reverse ray-tracing.
When you combine forward and reverse ray-tracing methods, a computer simulated ‘fire’ map can be generated. A forward ray-traced fire map shows you the places you are likely to observe fire in a diamond. A reverse ray-traced fire map shows you the places where you are likely to find a light source.
When you look at forward and reverse ray-traced fire maps together, it paints a picture of the likelihood that you will see fire in a diamond. Using a ‘fire matrix’, which is a series of both forward and reverse fire maps taken at different diamond tilt angles, you can get a full picture of the fire in a diamond.
Binocular Rivalry
The problem with almost all ray-tracing techniques is that it assumes that an observer sees the diamond through a single lens or eye. Humans of course have binocular vision and naturally see the world through both our eyes.
In reality, we see things slightly differently from each of our eyes and our brains actually merges the two images we see from each eye into a single image in real-time. When you look at a diamond, even if you have perfect vision, you will still be viewing it at a slightly different angle from each eye. Empirical tests on binocular rivalry have shown that if you see a flash of light in one eye, but not the other, our brains still tell us we see a flash of light.
In other words, we will only be able to see the light leakage if both our eyes see light leakage. In many cases, this means that a very small amount of light leakage that we can see in images taken with a camera using a single lens cannot be detected with our binocular vision.
Effective Total Angular Size (ETAS)
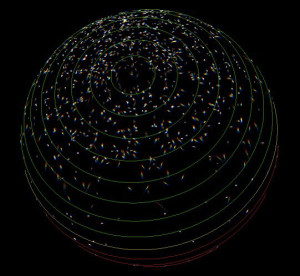
If we apply binocular rivalry to reverse ray-tracing, we end up with the idea behind ETAS. An ETAS map is a reverse ray-trace that takes into account of binocular rivalry to generate a hemisphere of ‘spaces’, each representing the location and size of the potential light sources in any given diamond. Below is an ETAS map generated using Octonus’s DiamCalc software.
Most ETAS maps are computer simulated ‘virtual’ ETAS maps as opposed to ‘real’ ETAS images created using actual laser beams. I’m not aware of any full real ETAS mapping technology that is available but it is theoretically possible to build such a device.
One of the advantages of virtual ETAS is that you can program it to tell you what you want to see. You can break down a diamond’s light performance and include only primary refractions (the rays of light that have only been refracted once before leaving the diamond) or you can add in the secondary, tertiary, etc. refractions in the ETAS map to allow you to view every light source every virtual facet in the diamond is picking up.
In comparison, the resolution of the ASET really only allows you to look at the primary and secondary refractions. The main disadvantage of virtual ETAS is that the accuracy of an ETAS map is dependent on the accuracy of the digital scan of the diamond.
ETAS is a very useful tool because it is a true map of all the potential light sources that we can see in a diamond. Essentially the more light sources that can be seen in an ETAS map, the more likely you will see that light source in the diamond. The spaces that represent the light sources in an ETAS map can be color-coded to show direction and the size of the spaces show you how big the light sources are.
Apart from evaluating light return (brightness) using ETAS, DiamCalc can also generate a Color ETAS (CETAS) to evaluate dispersion (fire), Dynamic ETAS (DETAS), which can evaluate scintillation (sparkle), and Negative ETAS (NETAS) for evaluating blind zones (areas where the diamond cannot see the light source).
Conclusion
Ray-tracing is a powerful technique that allows experts to gain insights about a diamond in three-dimensions that go beyond what is possible with reflector technology. As a rejection tool, ETAS maps are arguably as easy to understand as an Idealscope or ASET image and we can use the different variations of ETAS to quickly evaluate the light return, fire, and scintillation of a diamond.
Reference charts for ETAS maps will need to be developed and more consumers need to understand why they need yet another tool to evaluate light performance. Nevertheless, I hope that as our ability to measure diamonds and build computer models improve, that the ETAS also gains in popularity because it is a valuable tool to help us evaluate diamond light performance.
Before ETAS or a similar technology becomes available to consumers, we can still use all the tools that are available to put together a full picture of how a diamond performs. As always, if you’re looking for some help with your diamond search, please don’t hesitate to get in touch.


